How to download and process climatic data from climate data store (CDS)?
In this notebook, I have processed the temperature data for Gandhinagar Region in Gujarat. The Copernicus website gives a straightforward option to either download the data from their website or use their API to download the data. Download any data from Climate Data Source. Both of them work and takes approximately the same time. I have used the following requirement while using the API. These sets of data are also termed as the ERA5 dataset.
Requirement (Windows with Anaconda VIrtual Environment)
- Create an account here
- Install cdsapi via conda forge
- Install netCDF4 via conda forge
- Go to the directory: C://Users//Username and create a file name .cdsapirc
- Copy the URL and Key form here and paste to the file created above:
Open the file consiting the data. I downloaded the file from ERA5 website in NetCDF format. I choose 2m temerature for the month of June 2019 to November 2019. Use xarray and pandas to open and convert the data to pandas dataframe and save it as CSV
import xarray as xr
import pandas as pd
ds = xr.open_dataset('D:/temperature.nc')
ds
<xarray.Dataset>
Dimensions:    (latitude: 1801, longitude: 3600, time: 2929)
Coordinates:
  * longitude  (longitude) float32 0.0 0.1 0.2 0.3 ... 359.6 359.7 359.8 359.9
  * latitude   (latitude) float32 90.0 89.9 89.8 89.7 ... -89.8 -89.9 -90.0
  * time       (time) datetime64[ns] 2019-06-01 ... 2019-10-01
Data variables:
    t2m        (time, latitude, longitude) float32 ...
Attributes:
    Conventions:  CF-1.6
    history:      2019-12-30 07:17:58 GMT by grib_to_netcdf-2.15.0: /opt/ecmw...
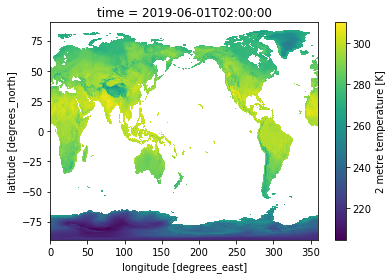
ds.t2m[2].plot()
<matplotlib.collections.QuadMesh at 0x19fce396d68>
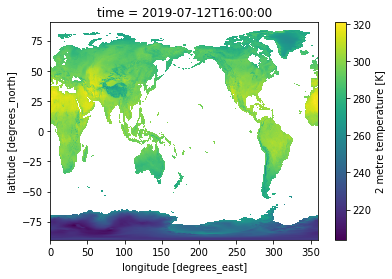
ds.t2m[1000].plot()
<matplotlib.collections.QuadMesh at 0x19fd03fc630>
The index in t2m is the 3rd dimention which is time. Below is choice of lat-long for Gandhinagar, Gujarat. This will filter the huge xrray in these coordinate values
newds=ds.sel(longitude=72.63, latitude=23.21, method='nearest')
#Convert to pandas dataframe and save it
df = newds.to_dataframe()
#convert kelvin to celcius
df['t2m']=df['t2m']-273.15
#save the dataframe for future use
x = df.to_csv('temperature-gandhinagar.csv')
Below is the code to retreieve data from copernicus website via API. This code is automtically generated from the same website
import cdsapi

c = cdsapi.Client()

c.retrieve(
    'reanalysis-era5-single-levels',
    {
        'product_type': 'reanalysis',
        'variable': [
            '2m_dewpoint_temperature', '2m_temperature', 'total_precipitation',
        ],
        'year': [
            '2018', '2019',
        ],
        'month': [
            '01', '02', '03',
            '04', '05', '06',
            '07', '08', '09',
            '10', '11', '12',
        ],
        'day': [
            '01', '02', '03',
            '04', '05', '06',
            '07', '08', '09',
            '10', '11', '12',
            '13', '14', '15',
            '16', '17', '18',
            '19', '20', '21',
            '22', '23', '24',
            '25', '26', '27',
            '28', '29', '30',
            '31',
        ],
        'time': [
            '00:00', '01:00', '02:00',
            '03:00', '04:00', '05:00',
            '06:00', '07:00', '08:00',
            '09:00', '10:00', '11:00',
            '12:00', '13:00', '14:00',
            '15:00', '16:00', '17:00',
            '18:00', '19:00', '20:00',
            '21:00', '22:00', '23:00',
        ],
        'format': 'netcdf',
    },
    'temperature.nc')